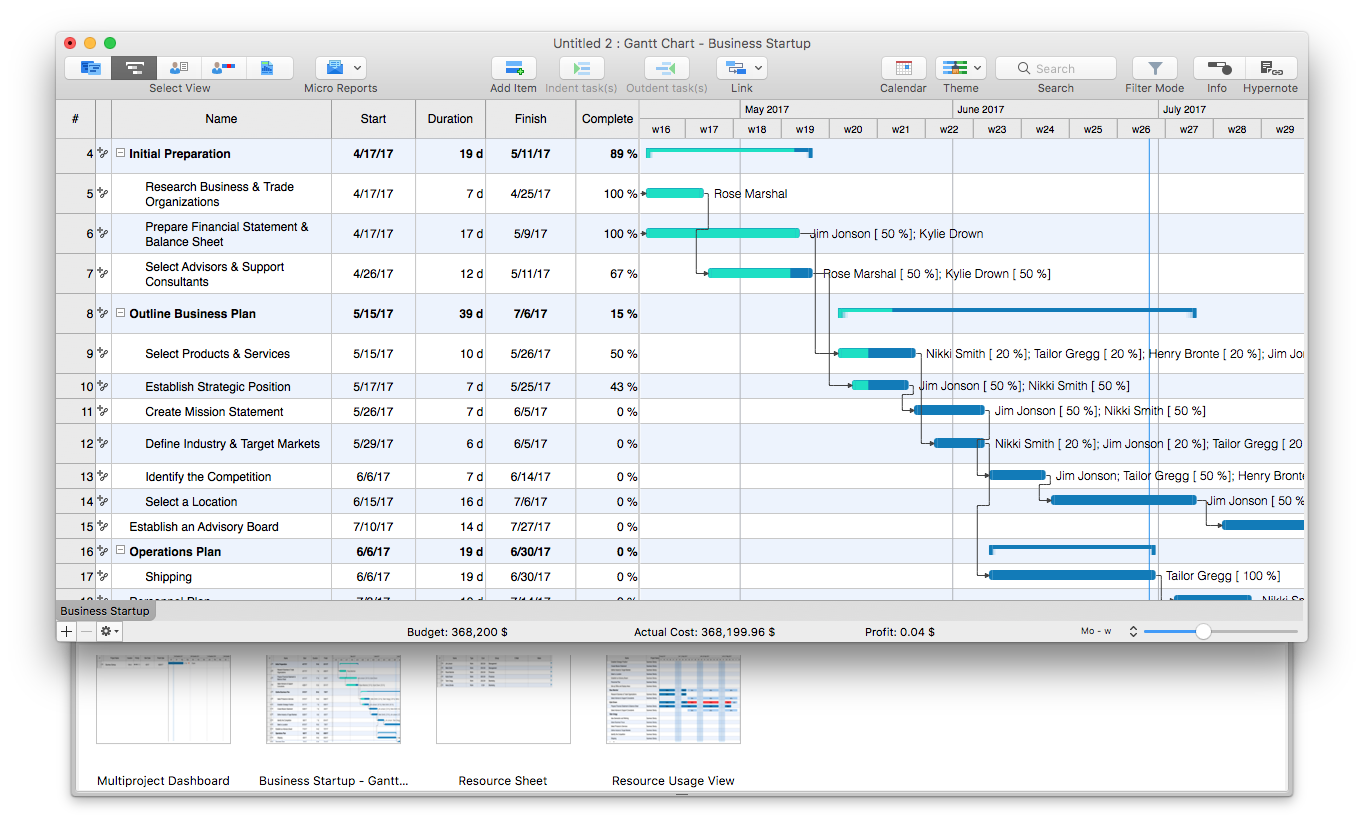
A Gantt chart is a bar chart used in project management depicting individual steps and processes in project execution, including their starting and ending points, the period during which each is ongoing, and how they relate to other steps and processes, all of which is to assure the project’s timely and proper completion.
There are various software programs available to create, utilize, and adjust a Gantt chart and therefore guide project managers in executing their given tasks.
The Gantt chart is named after Henry Gantt, an American engineer. The first recorded use of such a chart, however, was during the 1890s in Poland, where it was developed by Karol Adamiecki. The chart visualizing a project schedule consists of a list of project tasks, with individual tasks typically on the vertical axis and time intervals for individual tasks on the horizontal axis. The length of each bar indicates time to be consumed in a given task, its beginning and end. A line may be included between bars marking the dependency of one task on the fulfillment of another. There often is a second vertical axis representing the current date and dividing the chart into what is completed (left of the current date axis) and remaining to be done (right of the current date axis). The Gantt chart, however, only shows time scale and does not depict the relative size of constituent processes or tasks (e.g., in terms of demand for resources). Image credit: https://commons.wikimedia.org/wiki/File:ConceptDraw_Project_Gantt_Chart.png
Ganttův diagram je pruhový diagram využívaný v řízení projektů, který zobrazuje jednotlivé kroky a procesy v realizaci projektu včetně jejich začátku a konce, doby trvání a jejich návaznost na další kroky a procesy, díky čemuž je možné včasné a řádné plnění projektu.
Existují různé softwarové programy umožňující vytvořit, používat a přizpůsobovat ganttův diagram, a tím projektovým manažerům pomáhají vykonávat zadané úkoly.
Ganttův diagram je pojmenovaný po americkém inženýrovi Henrym Ganttovi. Poprvé však bylo jeho použití zaznamenané v Polsku v devadesátých letech devatenáctého století, kdy jej sestavil Karol Adamiecki. Diagram zobrazuje rozvržení projektu a skládá se ze seznamu dílčích úkolů, těchto úkolů obvykle zobrazených na vertikální ose a časových intervalů úkolů na horizontální ose. Délka každého pruhu značí časovou náročnost daného úkolu, jeho začátek a konec. Případná linka mezi pruhy určuje závislost úkolu na dokončení jiného. Diagram často obsahuje i druhou vertikální osu poukazující na aktuální datum, která jej dělí na dokončenou část (vlevo od osy aktuálního data) a zbývající část (vpravo do osy aktuálního data). Ganttův diagram nicméně zobrazuje jen časové měřítko a neukazuje relativní velikost zahrnutých procesů či úkolů (například ve smyslu náročnosti na zdroje). obrázek: https://commons.wikimedia.org/wiki/File:ConceptDraw_Project_Gantt_Chart.png
English Editorial Services’ mission is to assist international businesses and organizations of all sizes to communicate clearly, correctly, and persuasively with their business partners and target audiences.
Simply subscribe to receive our Business Term of the Day at no charge to your inbox each business day, with explanation in English and Czech.

Receive a Business Term of the Day from English Editorial Services to your inbox each business day, with explanation in English and Czech.

Are you a European firm with interests in the U.S. or an American company with interests in Central Europe? We are in the Heart of Europe and the Heartland of America. We can assist with communications, transactional advisory, local representation, and new business operations.
