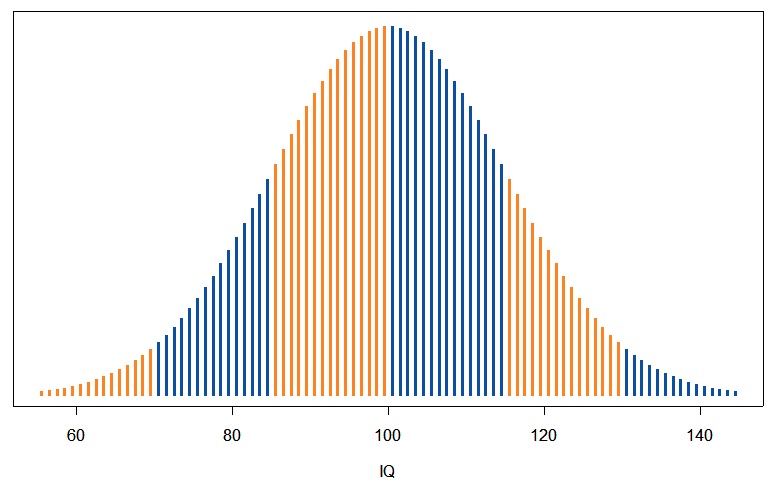
A bell curve is a graphical representation of a normal distribution, with the most probable values lying around the peak of the curve and less probable values sloping symmetrically downwards in both directions, thereby creating a shape suggestive of a bell.
The statistics of business success used to quite reliably form a bell curve, but, due to globalization and the associated existence of business giants, the winner-takes-all model occurs much more frequently these days.
A bell curve expresses the statistical measurement known as frequency distribution of certain phenomenon. The values of the observed phenomenon are on the x-axis and the frequencies of their occurrence are on the y-axis. Most data are found to be clustered around the mean (which in the case of perfect bell curve is equal to the median and mode), creating the peak of the bell shape. A great many naturally occurring phenomena tend to approximate the normal distribution (also known as the Gaussian distribution). A typical example of a bell-shaped curve is the graphical representation of IQ distribution within the population. This statistical tool is also used in finance, such as when analyzing the investment returns of securities and in pricing models. The further a security’s returns (measured in the case of equities, for example, by change in share price plus dividends paid) moves from the mean of its peer group, the greater may be the likelihood that the asset is over- or undervalued. This measure cannot, however, be relied upon too heavily, as most financial phenomena do not actually fall into the normally-distributed category.
Gaussova křivka je grafické znázornění normální distribuce, v níž nejpravděpodobnější hodnoty leží na vrcholu křivky a méně pravděpodobné hodnoty symetricky klesají v obou směrech, a tak tvoří tvar připomínající zvon.
Statistická úspěšnost podnikání dřív vcelku spolehlivě tvořila Gaussovu křivku, ale vzhledem ke globalizaci a s ní spojené existenci obchodních velmocí se dnes už běžněji objevuje model „vítěz bere vše“.
Gaussova křivka vyjadřuje statistické měření označované jako rozdělení četnosti určitého jevu. Hodnoty sledovaného jevu jsou na ose x a četnost jeho výskytu na ose y. Většina dat se shlukuje kolem střední hodnoty (která se v případě dokonalé Gaussovy křivky rovná mediánu a modu), a tak tvoří vrchol pomyslného zvonu. Spousta přirozeně se vyskytujících jevů se blíží normální distribuci. Typickým příkladem Gaussovy křivky je grafické znázornění rozložení hodnoty IQ v populaci. Tento statistický nástroj se používá i v oblasti financí například pro analýzu návratnosti z investic do cenných papírů a pro cenové modely. Čím víc se návratnost z cenných papírů (měřená například v případě kapitálu změnou ceny akcie plus vyplacenými dividendy) vzdaluje od střední hodnoty ve své kategorii, tím větší je šance, že aktivum může být přeceněné nebo podceněné. Na takové měřítko se však nelze plně spoléhat, protože většina jevů v oblasti financí ve skutečnosti nespadá do kategorie normální distribuce.
English Editorial Services’ mission is to assist international businesses and organizations of all sizes to communicate clearly, correctly, and persuasively with their business partners and target audiences.
Simply subscribe to receive our Business Term of the Day at no charge to your inbox each business day, with explanation in English and Czech.

